Two traders run the exact same strategy. One doubles their account over a year. The other slowly bleeds it away. Same rules, same instrument, same discipline. The difference is not skill or luck. It is the market regime each of them happened to be trading in.
This is the single most under-discussed idea in retail trading, and it quietly explains most of the confusion around what "works." Almost every strategy you will ever read about is a hidden bet on the market behaving a certain way. When the market behaves that way, the strategy looks brilliant. When the character of the market changes, the same rules keep firing and the same account keeps shrinking. Understanding regimes is how you stop blaming yourself for a losing streak that was really just the wrong tool for the conditions.
What a Market Regime Actually Is
A regime is just the market's prevailing character over a stretch of time. You do not need a physics degree to map it. Two questions get you most of the way there. First, is price trending or range-bound? Second, is volatility low or high? Cross those two and you get a practical four-quadrant map of the conditions you will actually face.
The Four Regime Quadrants
| Regime | Character | What Works | What Bleeds |
|---|---|---|---|
| Steady trend | Smooth directional drift, shallow pullbacks | Trend-following | Fading the move |
| Volatile trend | Strong direction, violent swings | Trend-following with wider stops | Tight stops, small fades |
| Quiet range | Sideways, contained, predictable bounds | Mean-reversion | Breakout entries |
| Volatile chop | Sideways but violent, no follow-through | Standing aside, smaller size | Almost everything |
The quadrants matter because they are not evenly kind to you. A steady trend is the easiest money most traders will ever make. Volatile chop is where accounts go to die, because both the trend crowd and the reversion crowd get sawed in half at once. The goal is not to label every day perfectly. It is to know roughly which room you are standing in before you pick a tool.
Every Strategy Is a Bet on a Regime
Here is the insight that reframes everything. There is no such thing as a strategy that works in all conditions. There are only strategies that monetize specific conditions and pay for the privilege in the others. Broadly, retail approaches fall into two camps that are mirror images of each other.
Trend-following bets that a move in motion will continue. Moving average crossovers, breakout entries above resistance, and MACD zero-line confirmation all belong to this family. They print money in trending regimes and get chopped to pieces in ranges, where every breakout is a false one and every crossover reverses two bars later.
Mean-reversion bets the opposite: that a stretched move will snap back. Fading RSI overbought and oversold readings, selling touches of the upper Bollinger band, and buying bounces off support are all reversion trades. They work beautifully in a quiet range and get steamrolled in a strong trend, where "overbought" just keeps getting more overbought for weeks.
Trend-Following vs Mean-Reversion: Mirror Images
| Dimension | Trend-Following | Mean-Reversion |
|---|---|---|
| Core bet | Moves continue | Moves revert |
| Profits in | Trending regimes | Range-bound regimes |
| Typical entry | Breakout, MA cross, MACD | RSI fade, band touch, S/R bounce |
| Win rate | Lower, few big winners | Higher, many small winners |
| Killed by | Choppy ranges | Strong trends |
| Worst enemy | Volatile chop | Sustained trend |
Notice that neither is better. They are opposite sides of the same coin, each designed to harvest exactly the conditions that destroy the other. A trader who insists their approach is superior has usually just been lucky enough to trade in its favorite regime.
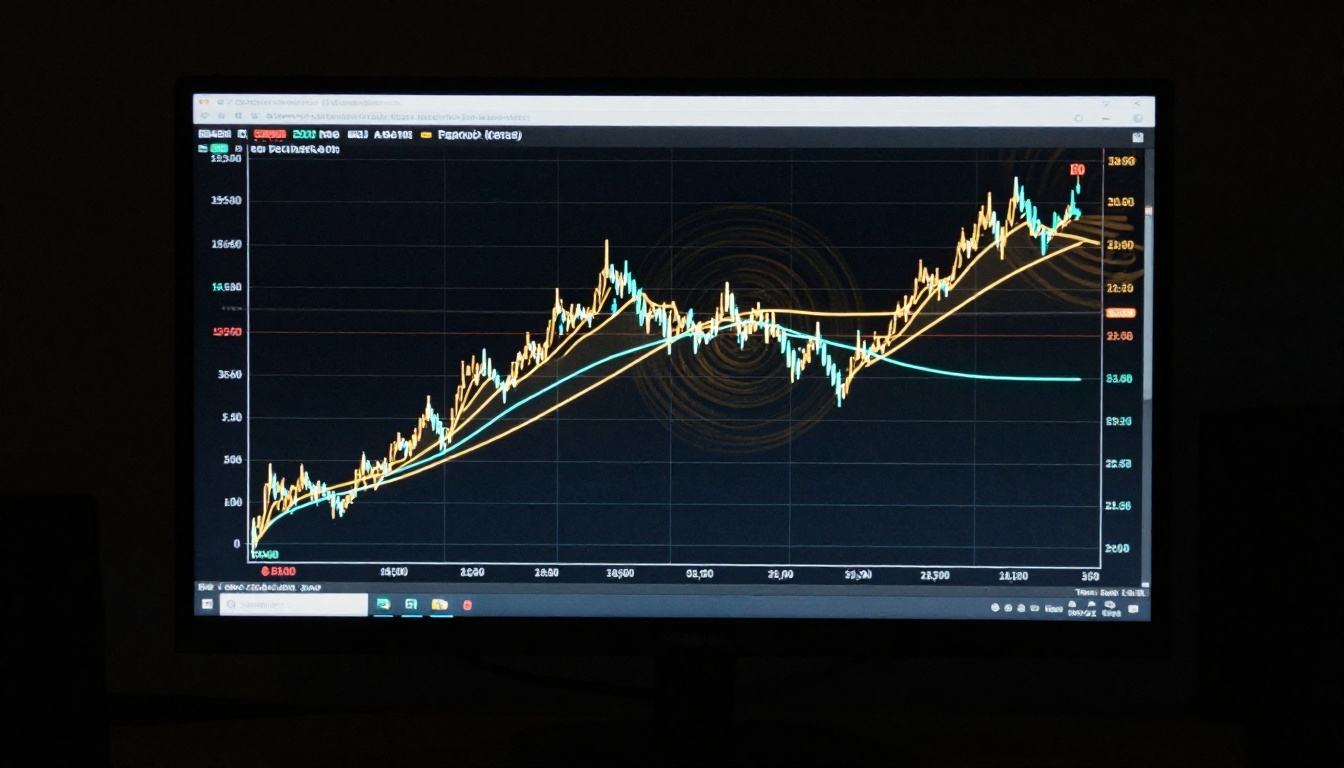
You can see the mechanism in a single picture. Below is a synthetic price series that spends its first stretch range-bound near 100, then breaks into a clean uptrend, with a 10-day moving average plotted on top. Watch what happens to a simple crossover signal in each phase.
Same MA Signal, Two Regimes
In the range portion, the average exists from day ten onward, and from day eleven through day fifteen price crosses it five times — every single day, price sits on the opposite side of the average from the day before. Five crossover signals in five days, every one of them a whipsaw that reverses immediately. A trend-follower gets stopped out over and over. Once the trend takes hold on day sixteen, price crosses the average zero more times. It simply pulls away and rides above the line all the way to 117. One clean signal that stays. Identical rule, opposite outcome, and the only thing that changed was the regime.
Why Traders Mistake a Regime for an Edge
This is where real money gets lost. Imagine a trader who starts fading extremes during a two-year range. Every oversold bounce pays. Every overbought fade works. They conclude, reasonably, that they have found an edge. They size up. Then the market shifts into a trend, their fades get run over, and the "edge" evaporates in a few brutal weeks. Nothing about their skill changed. The regime that was quietly paying them simply left.
This ties directly to a trap in backtesting a trading strategy. If your test window spans a single regime, your beautiful equity curve is not measuring the strategy. It is measuring the regime. A mean-reversion system backtested only across 2015 will look like printing press right up until you run it live into a trending 2017. The fix is to test across multiple regimes and to look at how the strategy behaves specifically when its favorite conditions are absent.
A backtest that spans one regime measures the regime, not the strategy.
Reading the Regime With Tools You Already Have
You do not need a new indicator to read the current regime. You need to use the ones you likely already know for a different purpose. Two dimensions, direction and volatility, map onto tools already covered here.
For direction, look at price relative to a longer moving average and, crucially, at the slope of that average. Price holding one side of a steep, persistent 50 or 200-period line is a trend. Price oscillating across a flat, whippy average is a range. For volatility, ATR and Bollinger band width tell you whether the market is quiet or expanding. A squeeze in band width flags a low-volatility regime; expansion flags a high-volatility one. Whether higher highs and higher lows are present, the language of chart patterns and structure, confirms the read.
A Regime-Reading Checklist
| Signal | Trending Reading | Ranging Reading |
|---|---|---|
| Price vs long MA | Holds one side | Oscillates across it |
| MA slope | Steep, persistent | Flat, whippy |
| ATR / band width | Expanding or high | Squeezing, contracting |
| Highs and lows | Higher highs, higher lows | Bounded by support/resistance |
| Pullbacks | Shallow, then resume | Reach the far side of the range |
The honest caveat: regime identification is easiest in hindsight. You will never call the exact bar where a range becomes a trend. That is fine, because prediction is not the job. The job is knowing which conditions your strategy needs to survive, and noticing early when those conditions have stopped holding.
What to Actually Do About It
Three practical moves follow from all of this. First, match the strategy to the regime rather than forcing one system through every condition. If you read a clean trend, trade with it; if you read a quiet range, fade the edges. Second, when the regime is ambiguous, which is often, reduce size or stand aside. Volatile chop has no reliable edge for most retail traders, and "no trade" is a position.
Third, and most usefully, treat drawdown differently depending on the regime. A drawdown while your strategy's regime is still present is normal variance, the cost of doing business, and no reason to abandon a system. A drawdown that begins right after the regime changed is a different animal entirely. That is not variance. That is the market telling you the conditions your strategy needs are gone. Learning to tell those two drawdowns apart is most of what separates traders who adapt from traders who blow up defending a dead edge.
Key Takeaways
- A regime is the market's character: trending or ranging, crossed with low or high volatility.
- Trend-following and mean-reversion are mirror images, each profiting from what destroys the other. Neither is superior.
- An "edge" that only ever worked in one regime is not an edge. It is a rented tailwind.
- Read direction from moving average slope, volatility from ATR and band width, structure from highs and lows.
- A drawdown inside your regime is variance; a drawdown after a regime change is a signal to adapt.
Disclaimer: This content is for educational purposes only and does not constitute financial advice. Trading involves substantial risk of loss. Past performance does not guarantee future results.