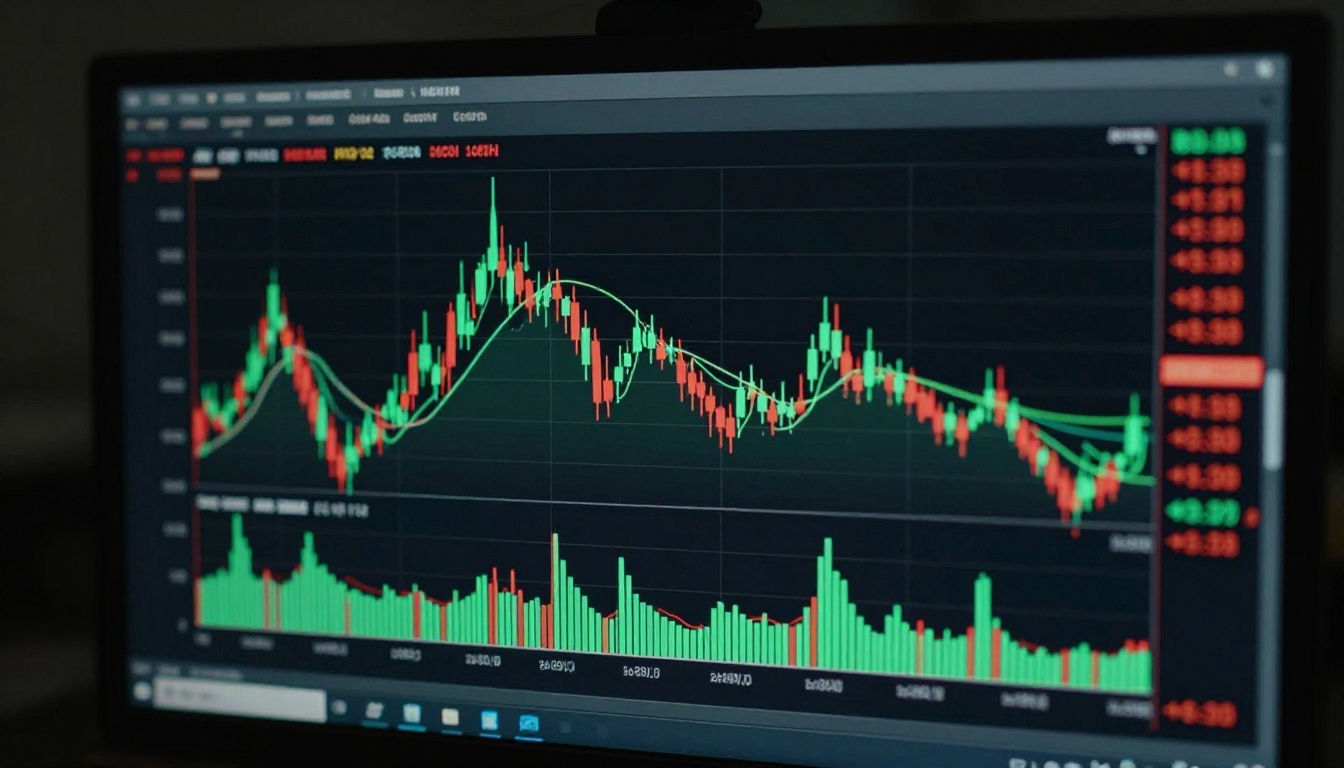
Nearly every technical tool reads one thing: price. Candlesticks, support and resistance, moving averages, RSI, MACD, chart patterns — they all describe where price has been and try to guess where it goes next. Volume reads something different. It does not tell you where price is; it tells you how many people showed up to push it there. That is participation, and participation is the closest thing a chart gives you to conviction.
This post covers volume on its own terms, then VWAP — the volume-weighted average price — the most-watched intraday reference among professional traders and, unlike almost everything else on your screen, the number institutions are literally graded against.
What Volume Actually Is
Volume is the number of shares, contracts, or units traded during a given period. On a daily chart, each bar is a full day of trading; on a five-minute intraday chart, each bar is five minutes of transactions. Higher volume means more participants agreed to transact at those prices. Lower volume means fewer did.
Here is the honest core of the whole subject: volume does not tell you direction. It tells you how much to trust the price move you are already looking at. A one percent rally on the heaviest volume of the month reflects broad agreement and real capital committed. The same one percent rally on the thinnest volume in weeks is a handful of participants nudging a quiet market, and it is far more prone to reversal. Same price move, completely different conviction behind it.
Volume as Confirmation
Because volume measures participation, its main job is confirmation, and this matters most at breakouts. When price escapes a range or completes a chart pattern like a triangle or flag, a breakout on expanding volume is far more trustworthy than one on declining volume. Heavy volume says real buyers are lifting offers, not a thin tape drifting through a level; light volume is the textbook setup for a false breakout that snaps back into the range. The logic reverses for trends: a rally making new highs while volume shrinks is a warning of exhaustion — price is rising, but fewer participants are willing to chase it.
Price Move vs Volume: What It Suggests
| Price | Volume | Interpretation |
|---|---|---|
| Rising | Rising | Healthy advance, broad participation — trust the move |
| Rising | Falling | Buyers thinning out, possible exhaustion — trust it less |
| Falling | Rising | Conviction selling, real distribution — trust the decline |
| Falling | Falling | Sellers exhausting, drift lower — watch for a base |
Read this as a lens, not a signal generator. Volume never fires an entry on its own; it grades the price action next to it. A move that agrees with its volume is one you can lean on more heavily than one that does not.
Volume Spikes and Climaxes
The loudest volume bars on any chart often print at turning points, not in the middle of calm trends. Capitulation selling — the moment holders finally give up and dump into a decline — tends to print the single highest volume bar of the entire move. Blow-off tops do the same thing in the other direction: a euphoric surge on enormous volume as the last buyers pile in.
The nuance that keeps you honest is important. A volume spike marks emotion, not an exact turning point. The heaviest bar tells you many people transacted under stress, which frequently happens near exhaustion — but it does not stamp the precise low or high in real time. You often only know the spike was the bottom several bars later, once price has turned. Treat a climax bar as evidence a move may be running out of participants, then wait for price to confirm — not as a bell that rings at the low.
VWAP: The Line Institutions Trade Against
VWAP is the volume-weighted average price over a session — across everyone who traded today, the average price paid, weighted by how much was traded at each level. A thousand shares transacted at a price pull the average toward it far more than a hundred shares do. The formula is a running total:
VWAP = cumulative(typical price × volume) / cumulative(volume), where typical price = (high + low + close) / 3
Critically, VWAP resets at the start of every session — a fresh line each day built from that day's participation, which is exactly why it is an intraday tool. It plays two roles. The first is a fair-value benchmark: price above VWAP means the average participant today is in profit and buyers have controlled the session; price below means sellers have. It is a single, participation-weighted read on who is winning the day.
The second role is what makes VWAP unusually powerful, and it ties directly to how large orders actually get filled. Institutions buying or selling millions of shares are measured on execution quality against VWAP — fill your buys below the session VWAP and you beat the benchmark; fill above it and you underperformed. Because so much real money is graded on that exact line, VWAP behaves like a magnet and a decision line intraday. Execution algorithms slice large orders to track it, which is a large part of why price so often gravitates back toward VWAP before continuing.
Reading Price Against VWAP
| Price vs VWAP | Session read | Common tactic |
|---|---|---|
| Above VWAP | Buyers in control | Favor longs, buy pullbacks toward VWAP |
| Below VWAP | Sellers in control | Favor shorts, sell rallies into VWAP |
| Crossing up through VWAP | Control shifting to buyers | Watch for continuation above |
| Repeatedly rejected at VWAP | Line acting as ~resistance | Fade the rejection, respect the level |
A Session Walked Through
Consider a stock across one trading day, sampled every thirty minutes. The chart below plots the closing price against the running VWAP.
Intraday Price vs VWAP
The bars below show the volume behind those closes, and the reason VWAP sinks to its low near 10:30 is right there: the day's heaviest bar prints exactly then, dragging the average toward that price.
Intraday Volume per Bar
The open is weak. Price falls through the morning on rising volume — 180, then 240, then a heavy 320 on the 10:30 bar, which prints the day's lowest close at $98.60 while price sits well below the VWAP of $99.22. That heavy bar is the emotional low, but you could not have called it in the moment; it only reads as capitulation in hindsight. The turn confirms on the very next bar: at 11:00 price closes at $99.30 and crosses back above VWAP at $99.19 — control has shifted to buyers.
From there, price holds above VWAP for the rest of the day and uses it as dynamic support, never closing back below it. The afternoon push to new highs comes on expanding volume again — 230 and 260 on the final two bars — exactly the confirmation you want behind a trend leg. By the close, price is $101.25 against a final VWAP of $100.04, a full $1.21 above it: buyers unambiguously won the session.
How Day Traders Actually Use VWAP
Day traders lean on VWAP a few consistent ways. In a rangebound session, they treat it as a mean-reversion target, fading stretches away from the line back toward it. In a trending session, they use it as dynamic support or resistance — buying dips to VWAP in an uptrend, selling rallies to it in a downtrend, as the worked example did. And many use a simple bias filter: longs only while price is above VWAP, shorts only while below.
Common Intraday VWAP Tactics
| Tactic | Best used when | Honest caveat |
|---|---|---|
| Mean reversion to VWAP | Rangebound, low-trend session | Fails badly in a strong trend day |
| VWAP as dynamic support/resistance | Clear intraday trend | Needs volume confirming the trend |
| VWAP as long/short bias filter | Any session, as a first read | A filter, not an entry by itself |
The caveat is baked into the tool: VWAP resets every day. It is meaningful intraday and close to meaningless on higher timeframes, because each session rebuilds it from scratch. If you swing trade or hold for days, VWAP is not your reference — this is a tool for people trading the session in front of them.
Honest Limitations
Volume and VWAP are confirmation tools, not standalone entry signals, and they come with real data-quality problems. The biggest is in forex. Spot forex is decentralized with no central exchange, so there is no consolidated, true volume figure — what your platform labels volume is usually tick volume, a count of price changes, not the actual amount traded. It is a rough proxy that correlates with activity, but it is not real volume, and any forex VWAP built on it deserves that caveat. Fragmented and over-the-counter markets have milder versions of the same problem: the volume you see may be only the slice that printed on one venue.
Even with clean exchange-traded volume, this is a lens on conviction, not a crystal ball — the same spirit as reading volatility with Bollinger Bands and ATR rather than trying to predict it. Volume tells you how much to trust price. It never replaces price, structure, or risk management.
Key Takeaways
- Volume measures participation, not direction — it grades how much to trust the price move you already see.
- Breakouts and trends backed by expanding volume are more trustworthy; those on shrinking volume are suspect.
- Climax volume spikes mark emotion and possible exhaustion, but not the exact turning point — wait for price to confirm.
- VWAP is a session-only fair-value benchmark and the line institutions are graded against — which is why it acts as an intraday magnet.
- Forex volume is a tick-count proxy, not true volume — apply extra skepticism there.
Price tells you what happened. Volume tells you how many people meant it.
Disclaimer: This content is for educational purposes only and does not constitute financial advice. Trading involves substantial risk of loss. Past performance does not guarantee future results.